I am working towards putting all the work I’ve been doing at Oak Ridge online, and one recent project has been data exploration for calcium 45 data and NIST BL2 data.
why am I doing this?
This boils down to: “why do data exploration?”, since in both of these use cases the motivations are the same as in most experimental sciences:
- You gather data, plan for sources of error, predict what will happen, and test, but after collecting the data you still want to get a good look at it. There could be problems you didn’t notice or unexplained trends.
- There are problems with your data that you anticipate, but you want to investigate
Really both of these come down to visualization. I used to think that data visualization was an inconsequential field, but I’ve spent hours on problems that I could have solved much faster if I had a good visualization of the subprocesses.
results
what do I want to understand?
There are two data sources – calcium 45 and NIST. I am more familiar with the calcium 45 data, since that experiment is a precursor to the Nab Experiment, which is what I’ve been working on for two years. For the calcium 45 data, there are a variety of effects at play:
- data acquisition effects
- some of the data is partially overwritten
- some of the data is partially corrupted
- the data acquisition system’s behavior changes across particle energy ranges
- physics effects
- some particles hit the same detector twice in a short time
- some particles hit a detector edge and deposit energy in two detectors
- some particles are actually cosmic rays
- the setup has physical oscillations
Applying clustering methods allows an exploration of these problems. For instance, if the system is shaking, there are several follow up questions such as “How much does this affect the signal?” and “What is the frequency of oscillation?”.
how did I explore the data?
For both data sources, I tried multiple different approaches to clustering or exploring the data. I varied the preprocessing significantly: I cut the data based on energy, normalized in different ways, filtered in an attempt to undo the data acquisition system’s electronics shaping, and cut the data based on the geometry of the detector. I also tried to extract different clusters using all sorts of methods, from parametric to nonparametric.
what did I find?
For the real results, check out the github page: link
The results I cared about most:
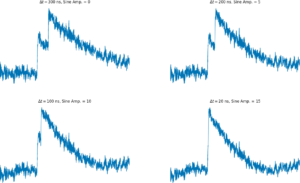
- There are significant oscillations with a pretty specific shape that is large enough to matter
- There is a change in the shape of the signal as it changes in energy that has been simulated by Monte Carlo by Tom Shelton, but it was cool to see it in the real data
- The NIST data is full of this effect called “preamp saturation”, an effect from very high particle energies
- The data is very nonlinear, so the nonparametric approaches were the only successful ones.
- As a side note, the cluster means from k means clustering seem to make good basis functions for pseudoinverse fitting


